NPTL Trace Tool

PAJE

Home

User Manual

Internals

Trace points
Data collecting
Glibc patch
Pajé

Forum

Download

Sourceforge project info

Licence


Pajé

The current version of PTT makes it possible to get a graphical representation of traces with the help of Pajé. This tool provides interactive and scalable behavioral visualizations of parallel and distributed applications. Because of its genericity, it can be used unchanged in a large variety of contexts. Pajé trace files contain three kinds of information :

  • definition of the event formats.
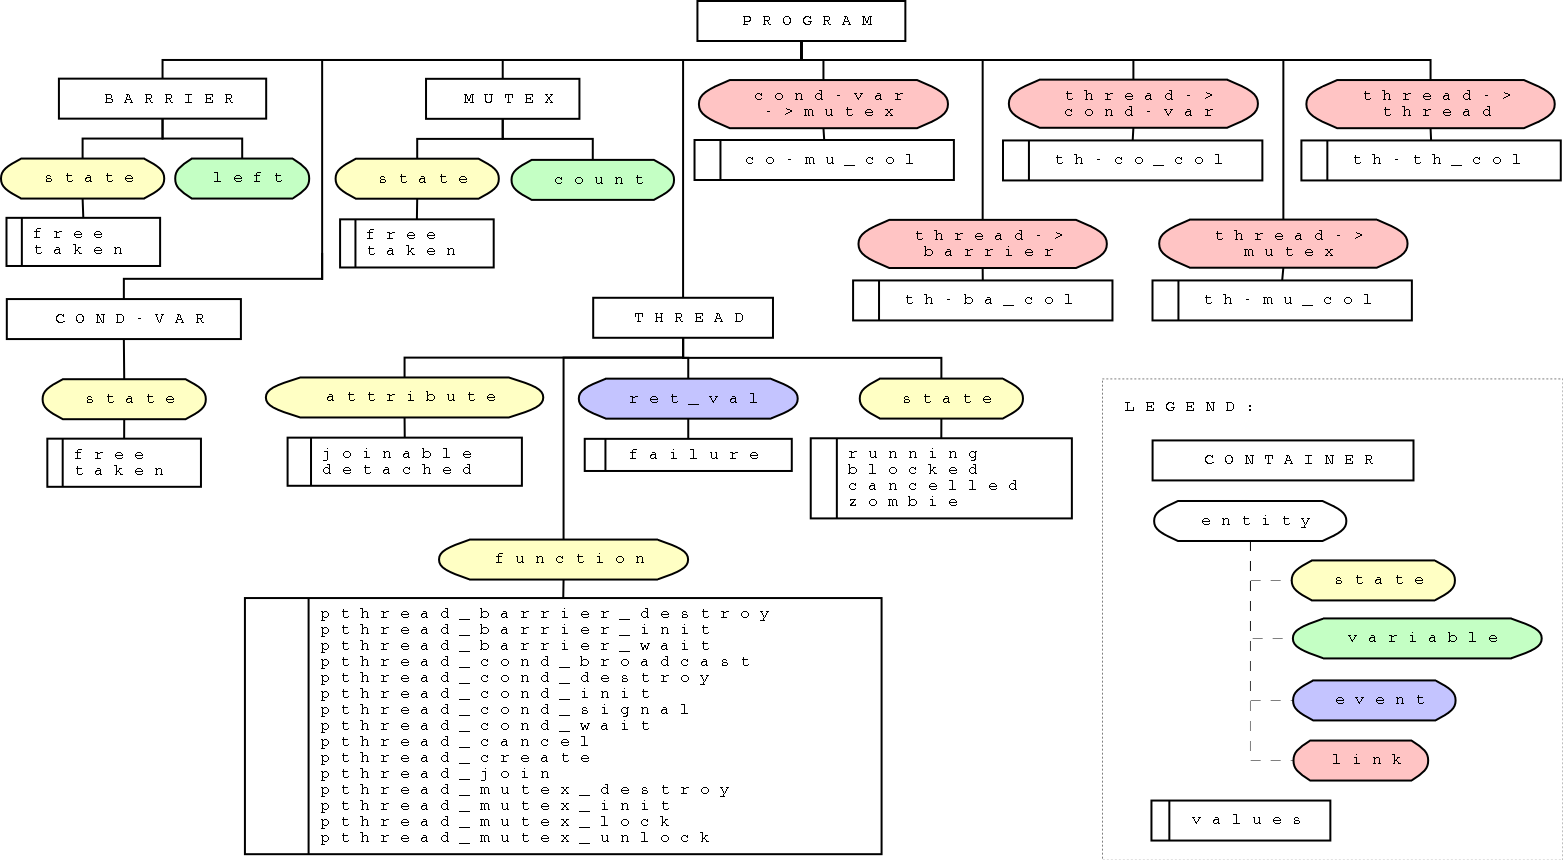
  • definition of the type hierarchy of the objects.
  • a set of recorded events, complying with the format definition.

Trace event formats

The Pajé data format is self-defined: the event definition is put inside the trace file itself. A "meta-format" is used to define :

  • the format of instructions defining containers and entities.
  • the format of events recorded during the execution of parallel programs.

The event definition part follows the following format :

  • each line starts with a '%' character.
  • each event definition starts with a %EventDef line and ends with a %EndEventDef line.
  • The %EventDef line contains the name and the identifier of the event type. The identifier is a unique number used to identify the event in other parts of the file.
  • the fields of an event are defined between the %EventDef line and the %EndEventDef line, one field per line, with the name of the field followed by its type.

Trace event formats are common for all generated trace files.

Type hierarchy

A visualization built by Pajé is composed of objects organized according to a tree type hierarchy. The nodes are called containers and the leaves entities.

In Pajé, it is possible to define new types of containers and new types of data which can be visualized as events, states, links and variables:

  • an event is an entity representing an instantaneous action.
  • a state is an entity representing a variation in time.
  • a link is an entity representing some form of connection between a source and a destination container.
  • a variable is en entity storing the temporal evolution of the successive values of a data associated with a container.

The type hierarchy is common for all generated trace files. It can be modified by the following ptt_paje options:

  • the -d option displays everything.
  • the -m option masks threads' states and threads' attributes.
No option masks threads' attributes and shows threads' states.

Here is a diagram of the type hierarchy:

Click to view

Graphical trace description

An event is represented as a red pin.

A state is represented as a rectangle which color varies according to its value. The meaning of the color can also be displayed as letters. Capital letters identify the container type (B = barrier, M = mutex, T = thread, CV = conditionnal variable). Small letters identify the state (f = free, t = taken, r = running, b = blocked, c = cancelled, z = zombie, j = joinable, d = detached).

A link is represented as a vertical arrow.

A variable is represented as a graph.

Here are the colors of barriers' states (free, taken).

Here are the colors of conditionnal variables' states (free, taken).

Here are the colors of mutexes' states (free, taken).

Here are the colors of threads' attributes (detached, joinable).

The color of a thread function depends on the object concerned (barrier, conditionnal variable, mutex, thread).
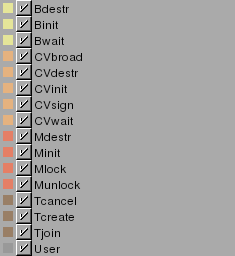
Here are the colors of thread's states (blocked, cancelled, running, zombie).


Page hosted by :
SourceForge.net Logo